 www.adoxx.org
  Resource Navigator
Requirement: Mechanisms and Algorithms
DETAILS: ADOxx Dashboard
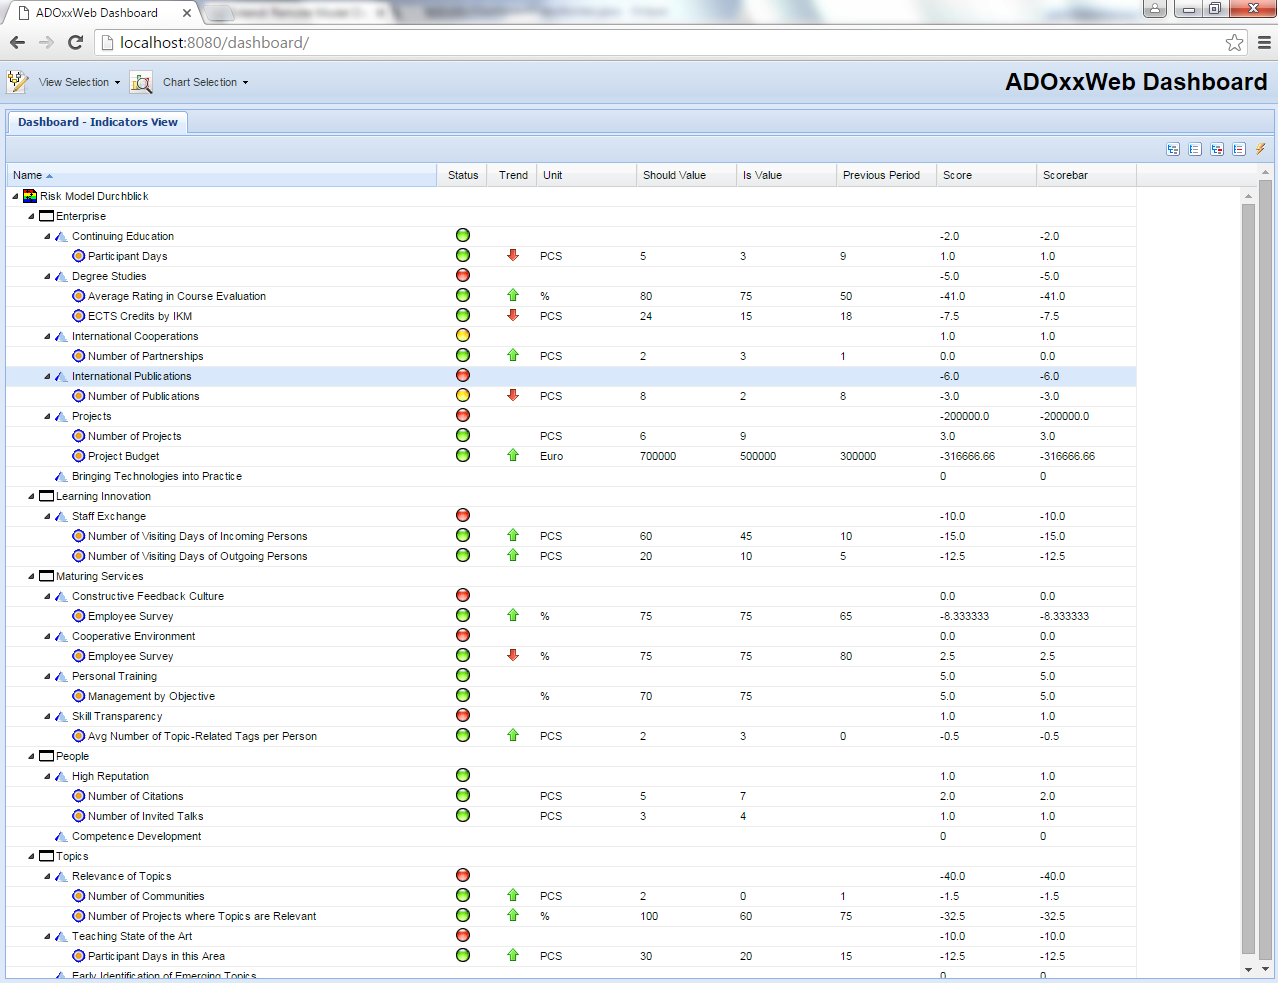
This building block enables the visualization of your models/data in a so called Dashboard as a tree structure. The idea is to deploy a monitoring mechanism of your models on a server. This allows you to have an overview of your models/data through a web browser and keep track of them.
HOW DOES IT WORK?
The idea of implementing this building block is transforming the data store of your models into a .jason file which is then used for deploying your data on a web application. The information contained in your models can than be displayed on a web browser.
The input of this web application is a so called cockpitXML. The datastore of your models has to be exported in cockpitXML structure in order to run the transformation to the data.jason file. For more details and implementation instructions see the Extend section.
Example:
FEATURES AND FUNCTIONALITY
Characteristics of the Dashboard building block:
- Modelling language dependent: Any modeling language can be vizualized as above, but one has to adjust the cockpitXML accordingly (see Extend).
- The cockpit vizualizes your datastore of your models in a clear tree structure. The data which should be displayed can be added in the cockpittransform.xsl (see Extend).
EXTEND: ADOxx Dashboard
In the following we explain how you can integrate/adopt the ADOxx Cockpit, customize it for your needs, and finally deploy it on a server of your choice.
1. Setup of Development Environment
The proposed development environment consist of the following tools and technologies:
- Eclipse IDE for Java EE Developer: as an integrated development environment we propose to use the Eclipse EE environment, necessary plugins are listed as technologies below. The version used for this documentation is "Mars".
- Maven: as a build and dependency management environment. In case you are new to Maven, have a look a the brief introduction online here (Maven in 5 minutes). The necessary plugin for Eclipse is available here.
- Java: as the baseline technology for realizing the building block. The tested/used version is Java JDK 7.
- SVN: the source code of this building block is maintained in the ADOxx.org SVN Repository. Make sure to have the SVN plugin for Eclipse installed to check-out and commit directly from within your IDE.
As a prerequesite to get started, make sure to have the Eclipse IDE up and running and the necessary connectors/plugins for Maven and SVN installed.
2. Check-out 'ADOxx Dashboard WebApp' Project from SVN
The ADOxxWeb Cockpit consists of one web application project.
The project is accessible in the SVN:
https://www.adoxx.org/svn/devtools/ADOxxWeb Dashboard WebApp
For importing the Project please follow the steps below:
A. Right-click in the project explorer, select "Import" -> "Import project from SVN"
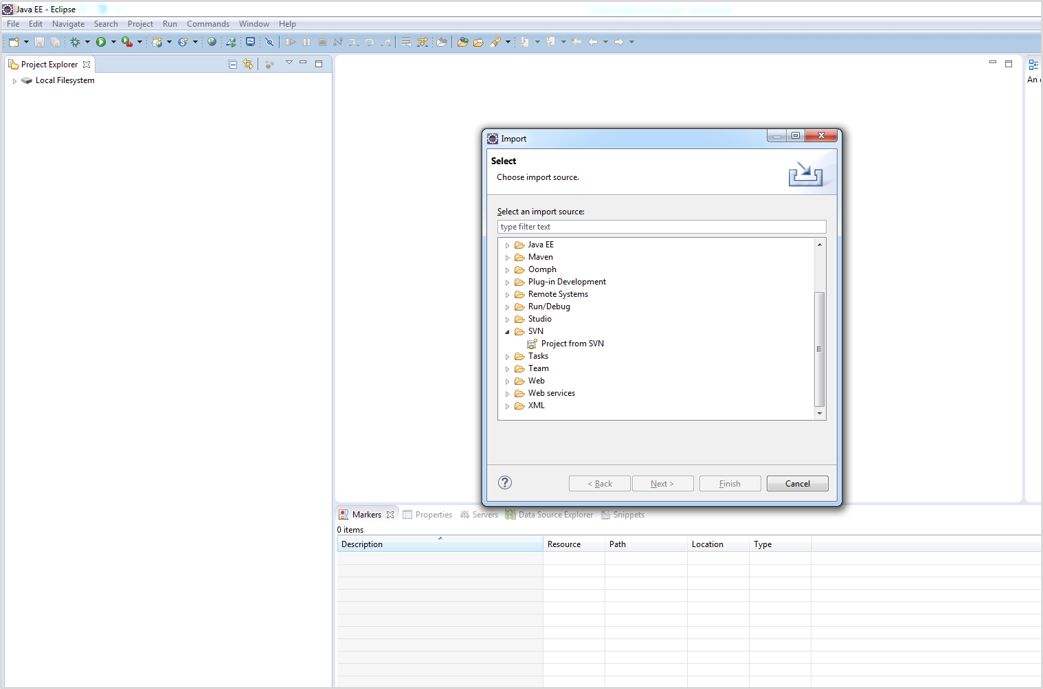
B. Enter the URL of the project (as listed above). Since the ADOxx.org SVN is public, no username or password is needed.
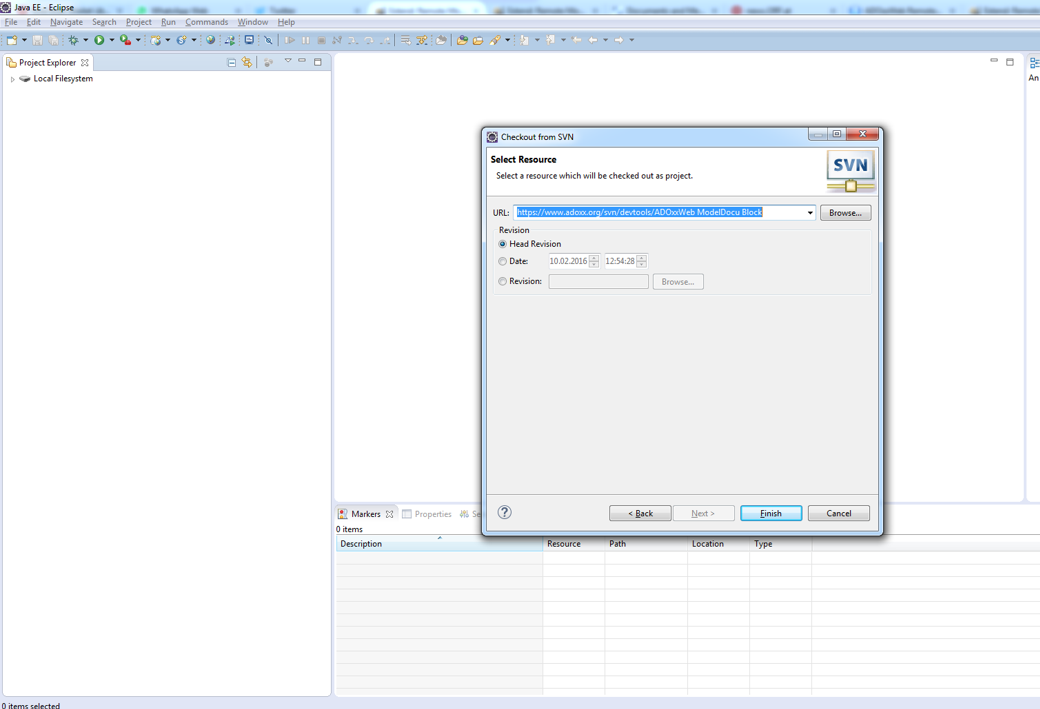
C. Click on Next and Finish to trigger the checkout (in the next steps you can configure the name of the project in Eclipse, in case you want to update, please use the respective wizard steps).
3. Perform an Initial Build/Resolve Dependencies
As a preparation action, make sure that the project is installed in the local Maven repository. The steps for installation are performed by:
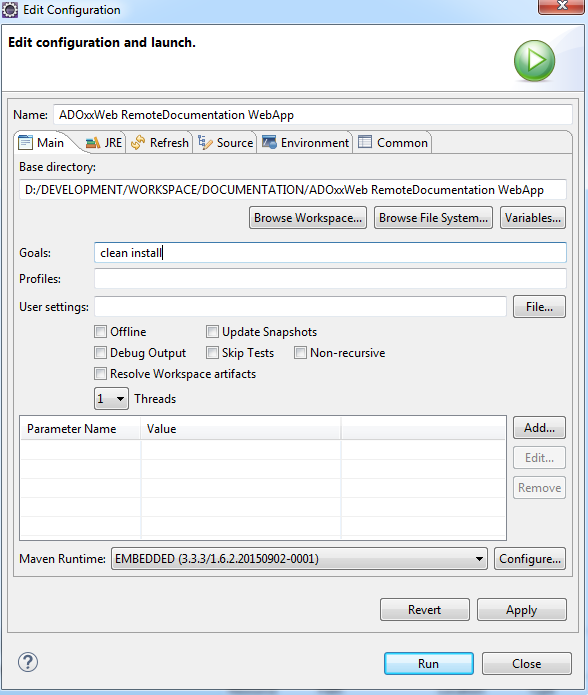
A. Right-click on the project -> "Run as" -> "Maven build..."
In the "Goals" field enter "clean install". Click on "Run" to trigger the clean-up of the project first and then installation the projects (installing implies the resolution of dependencies).
B. Review the console log. In case of error statements, you can re-run the build and add -X to have a full log of all activities.
4. Validate Debug/Development Deployment
For local validation and debugging, you can start the modeldocu only in a Apache Jetty Container.
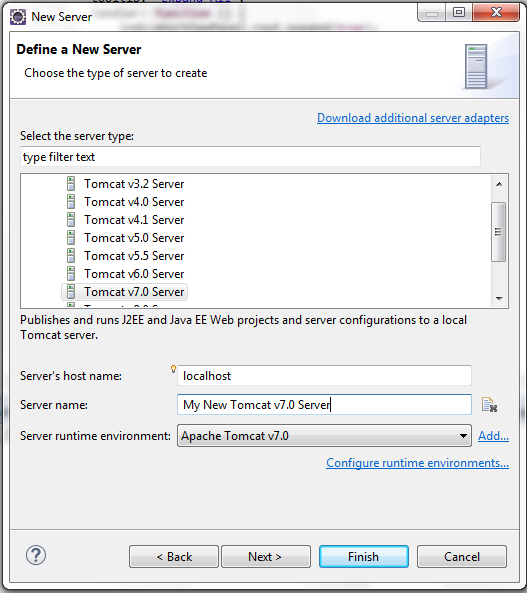
A. Create a New Tomcat Server: "File" -> "New" -> "Server"
B. Right-click the ADOxxWeb DashBoard WebApp project and select "Run as" -> "Run on Server" -> Select the new created Server
The block is deployed on the server and is accessible at http://localhost:8080/dashboard.
See also the online example.
An important aspect is that this allows to debug a block directly, the wrapper web application should be used for productive deployment (e.g. WAR file on Apache Tomcat).
C. Create a WAR file for Productive Deployment
To create a deployable WAR file, right-click on the ADOxxWeb Dashboard WebApp project, select "Run as" and "Maven build ...". Enter "clean install" in the "Goals" field and hit "Run".
This creates a new WAR file in the "target" folder of the project. Use this WAR file to deploy it in a e.g. Apache Tomcat container.
In case you receive error messages for step 3 or 4 in the following message "No compiler is provided in this environment. Perhaps you are running on a JRE rather than a JDK?", make sure that you have a JDK installed and on the build path.
EXAMPLE: Customization of the Dashboard
As an example we take the above imported project with the sample cockpit.xml and make some adjustments for documentation purposes.
A. Modify/change 'src/main/webapp/cockpit.xml' or import a new one
(i) Modify/change the content
As the 'src/main/webapp/cockpit.xml' contains all the information that should be vizualized through the cockpit you can fill it with your data, which you want to monitor.
Cockpit.xml -> adjust also the 'src/main/webapp/transformcockpit.xsl' file accordingly (see B).(ii) Import a new cockpit.xml
- Drag and drop the new myNewCockpit.xml file into the 'src/main/webapp/' directory.
- Open '
src/main/java/org/adoxx/dashboard/utils/DashboardTransformer.java' file. This is the java file that transforms the cockpit.xml file to the .json file.
In line 29 change the name of the file whcih should be transformed from 'cockpit.xml' to 'myNewCockpit.xml'.
USE CASE: Monitoring the Goals and Key Performance Indicators
In the following the "Cause and Effect Model" model type, which is a part of the modeling language of ADOscore®, is taken as a starting point for the vizualization of a meta model in the cockpit.
In this case the ADOxx dashboard cockpit enables the monitoring of the current status/values of an organizations goals and Key Performance Indicators. Therefore an ADOxx application library with the appropriate modeling langage is required (See Figure below).
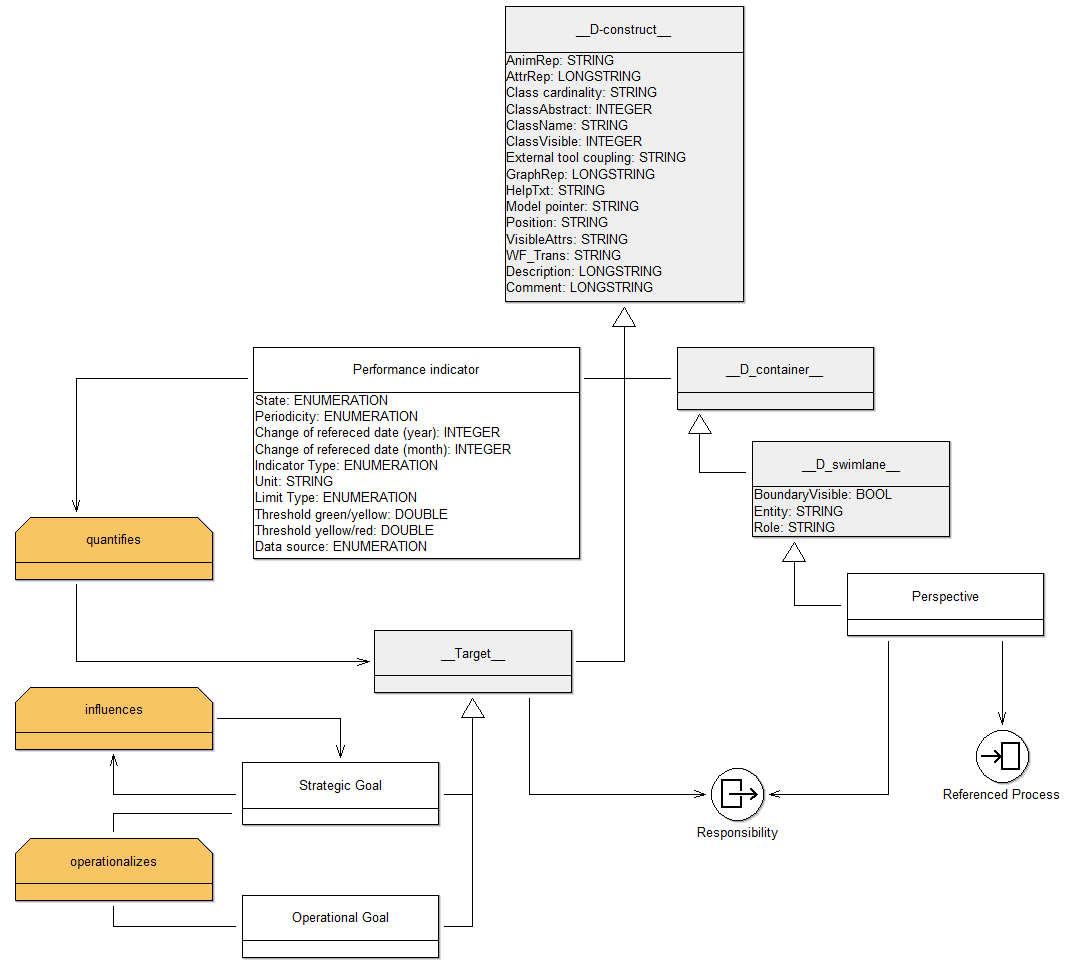
Metamodel of "Cause and Effect Model" model type
In order to display the datastore of the model in the cockpit you need two XSL-transformations:
1) The first one performs a transformation from the ADOxml to the so called COCKPITxml. The COCKPITxml has a tree structure, where very model is a source node and the perspectives are their ancestors. To every perspective the corresponding goals and KPIs are subordinated in the following structure:
COCKPITxml.xsd
2) The second transformation converts the above received COCKPITxml file to a .jason file. This jason file contains all information to deploy the Cockpit on a web server (see above!).
The first transformation is performed within the ADOxx environment and can be implemented as follows:
Resources:
- Sample library:
You can include the classes in to your library or take the sample library, where the "Cause and Effect Model" model type is already included.
Cause and Effect Model Library.abl
Cause and Effect Model Library.all
- Transformation from ADOxml to COCKPITxml
ADOXML2COCKPIT.asc
adoxml2cockpit.xsl
Hands On:
1) Adopt the modeling language of the "Cause and Effect Model" model type into your application library or use the 'Cause and Effect Model Library' (see above).
2) Import ADOXML2COCKPIT.asc and adoxml2cockpit.xsl files into your library (See Video tutorial)
3) Copy the following Adoscript code into the library attributes 'Add ons'
######################################################
############# Generate COCKPITxml ####################
######################################################
ITEM "Generate COCKPITxml" importexport:"Documentation"
EXECUTE file:"db:\\ADOXML2COCKPIT.asc"
(i) adjust the
adoxml2cockpit.xsl(ii) adjust the
transformcockpit.xsl according to the data.jason variables.(iii) adjust the dashboard.js file (see C).
In the following to display a new attribute 'MyNewAttribute' for class Key Performance Indicators in the cockpit.
(i) adjust the adoxml2cockpit.xsl
ad to the 'Description' Chapter node of the '<xsl:template match="instance[@class='Performance indicator']">' template an attribute element as follows:
<xsl:element name="ATTRIBUTES"> <xsl:attribute name="NAME">MYNEWATTRIBUTE</xsl:attribute> <xsl:attribute name="TYPE">
<xsl:value-ofselect="./attribute[@name='MyNewAttribute']/@type"></xsl:value-of>
</xsl:attribute> <xsl:element name="VALUE"> <xsl:value-of select="./attribute[@name='MyNewAttribute']">
</xsl:value-of> </xsl:element></xsl:element>(ii) Configure cockpittransform.xsl
- Assign the value of 'MYNEWATTRIBUTE' node to a variable (-> data.jason file):
<xsl:text>', myvalue:'</xsl:text><xsl:value-of
select="./CHAPTER[@NAME = 'Description']/
ATTRIBUTES[@NAME = 'MYNEWATTRIBUTE']/VALUE" />- Define default values for the attribute value (optional):
<!-- default to none values for model and default icon --><xsl:text>', iconCls:'icon-uwd', status: '', trend: '', unit:'',
myvalue:'', should: '', is: '', prevperiod:'', scor:'',
scorbar:'',children:[</xsl:text>See section C
B. Mapping the datastore to the .jason file
In order to translate the COCKPITxml file to jason file, please choose one of the following two possibilities:
- Copy/paste the content of the COCKPITxml file, which is created by the first implementation into /src/main/webapp/cockpit.xml' and save.
- Import the COCKPITxml file into the '/src/main/webapp/' directory and change the name of the file which should be transformed in
'/src/main/java/org/adoxx/dashboard/utils/DashboardTransformer.java' line 29.
The transformation from the cockpit.xml to the data.jason file is performed by the src/main/webapp/transformcockpit.xsl file.
This transformation maps the datastore of the cockpit.xml to variables in the data.jason file (e.g.: Name, Status, ...).
C. Customize the Dashboard
In the following the customization of the columns of the dashboard will be performed. This can be done in the 'src/main/webapp/js/dashboard.js' file. Within this file the columns are assigned to the variables that are defined in the data.json file. Therefore you can add/remove/change columns in the following syntax:
  columns : [
          {
               header : 'MyFirstColumn',
               dataIndex : 'MyFirstVariable',
               width : 430
          }, {
               header : 'MySecondColumn',
               dataIndex : 'MySecondVariable',
               width : 100
          } ],
  dataUrl : 'data.json'
Columns: Every node which is defined within ththis section is a column in the dashboard.
header: defines the name of the column in the header.
dataIndex: defines the variable that is assigned to the column from the data.json file.
width: defines the width fo the column.
dataURL: is the name of the .json file which is created in the above transformation.